Line Chart Custom Widget Tutorial
Custom widgets are a powerful way to personalize your TagoIO dashboards, providing unique features and visualizations tailored to your specific needs. In this tutorial, we'll walk you through the process of creating custom widgets using the TagoIO Custom Widget GitHub repository. Follow these steps to unlock a new level of customization for your dashboards.

Prerequisites:
Before you begin, ensure you have the following:
- A TagoIO account: You need an active TagoIO account to access the dashboard and deploy custom widgets. Create your account.
- Basic knowledge of TagoIO: Familiarize yourself with TagoIO's platform and understand the basics of creating and managing dashboards. Access our Learning Center and check out our training modules.
- Node.js and npm: Before you can create custom widgets, ensure you have Node.js and npm (Node Package Manager) installed on your machine.
Clone the Repository
Visit the TagoIO Custom Widget GitHub repository: tago-io/custom-widget-public (github.com)
Clone the repository to your local machine by running the following command in your terminal:
Explore the Repository
Navigate to the cloned directory and open the README.md file. This file contains essential information about the custom widgets, including installation instructions and examples.
Take the time to understand the structure of the repository, the available Line Chart widget, and its functionalities.
Install Dependencies
Inside the cloned repository, run the following command to install the necessary dependencies:
- npm install
This command installs the required packages specified in the package.json file.
Build the Custom Widget
Before building the project, it's crucial to update the build script in the package.json file with your specific TagoIO profile ID and chart folder. Follow these steps:
Open the `package.json` file in the root directory of the cloned repository.
Locate the "scripts" section and find the "build" script. It should look like this:
- "build": "vite build --base /6021b441fc48a400183c9604/storage/chart",
Replace `/6021b441fc48a400183c9604/storage/chart` with your specific TagoIO profile ID and chart folder. The updated line should look like this:
- "build": "vite build --base /YOUR_PROFILE_ID/storage/YOUR_CHART_FOLDER",
Replace `YOUR_PROFILE_ID` and `YOUR_CHART_FOLDER` with your actual TagoIO profile ID and chart folder.
Now, you can build the project using the following command:
- npm run build
This command will create a production-ready build of your Line Chart widget in the `_dist` directory.
Upload the content from the `_dist` directory to the file system inside TagoIO.
After successfully building the widget and uploading it to TagoIO’s Files, you can proceed to deploy it on your TagoIO dashboard using the steps mentioned in the next session.
Deploy the Custom Widget on Your TagoIO Dashboard
Now that your Line Chart widget is built and ready, deploying it to your TagoIO dashboard is a breeze. Follow these steps:
After successfully running the build command (`npm run build`), your widget is now ready for deployment.
Go to the TagoIO dashboard where you want to add the Line Chart widget.
Click on the "+" button to add a new widget.
Select "Custom" from the list of available widget types.
In the configuration settings for the custom widget, locate the field for the widget URL.
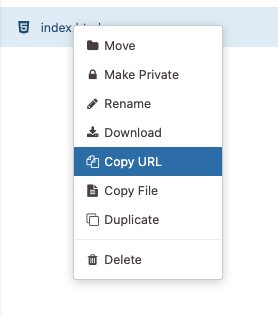
Head to your TagoIO Files system and find the URL of the widget you just built. It will typically be in the format:
Copy the URL of the widget.
Paste the widget URL into the configuration field of the TagoIO custom widget.
Save the widget configuration.
Add data to your Line Chart
To add values to your line chart it expects to receive data in the following format:
- {
- "variable": "variable_name",
- "unit": "%",
- "group": "unique_group_value",
- "value": "Label of the variable in the chart",
- "metadata": {
- "2023-01-01T00:00:00.000Z": 10,
- "2023-01-02T00:00:00.000Z": 15,
- "2023-01-03T00:00:00.000Z": 20,
- "2023-01-04T00:00:00.000Z": 25,
- "2023-01-05T00:00:00.000Z": 30,
- "2023-01-06T00:00:00.000Z": 35,
- "2023-01-07T00:00:00.000Z": 40,
- "2023-01-08T00:00:00.000Z": 45,
- "2023-01-09T00:00:00.000Z": 50,
- "2023-01-10T00:00:00.000Z": 55,
- }
- }
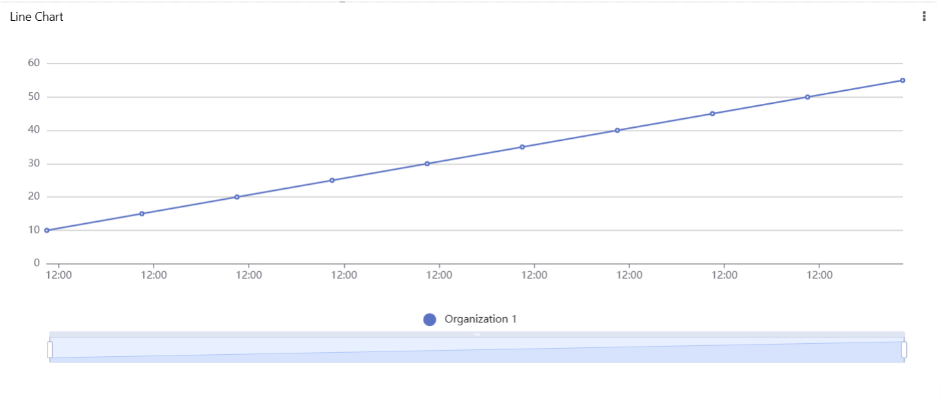
You can add this example variable to your device’s bucket using the emulator feature
Now your line chart will look like the image below.
Optional Step: Develop New Widgets
If you're eager to create a completely custom widget tailored to your unique requirements, you can embark on the development journey. Follow these steps:
Explore the development section in the README documentation for a comprehensive guide on setting up a development environment.
Create a new widget by coding it according to your specifications. You have the flexibility to use plain JavaScript or opt for a more structured approach with frameworks like Angular, React, or Vue.js.
Test your newly developed widget locally to ensure it meets your expectations.
Once satisfied with your custom widget, you can integrate it into your TagoIO dashboard following the deployment steps outlined earlier.
Remember, developing a custom widget allows you to unleash your creativity and build a widget that perfectly aligns with your dashboard's requirements. Refer to the official documentation for additional guidance and tips during the development process.
Congratulations! You've successfully deployed your custom Line Chart widget on your TagoIO dashboard. Explore the visualization and interact with your data using the newly added widget.
Continue refining your dashboard by experimenting with various custom widgets and configurations. For more advanced features and customization options, refer to the official documentation. Happy widget designing!
Topic Participants
Philip Cotrin