How to save storage and I/O using metadata
In this article, we are going to learn how to work with metadata and display their values in a dashboard.
Metadata can be used to drastically reduce the number of Input/Output transactions and register storage used. Metadata simply allows us to add extra data by appending it to a variable.
Important things to know before using metadata:
Metadata information is not checked by the Action. - This means you won't be able to trigger an Action based on specific variable that is inside your metadata object, and you'll have to switch the key over to the variable's value.
You need to you formulas to display the metadata in the widget. - Good news is that this is very easy to do.
It is not possible to create an Analysis that will easily access the metadata information, it is necessary to know which main variable the metadata is associated with. - This is because when creating a query you won't be able to filter the device data by the metadata key.
There is a limit of metadata size per post, today it is set to 10kB.
Still, metadata can be very helpful as it provides a very cost effective way to store data. So here's an example on how to use metadata:
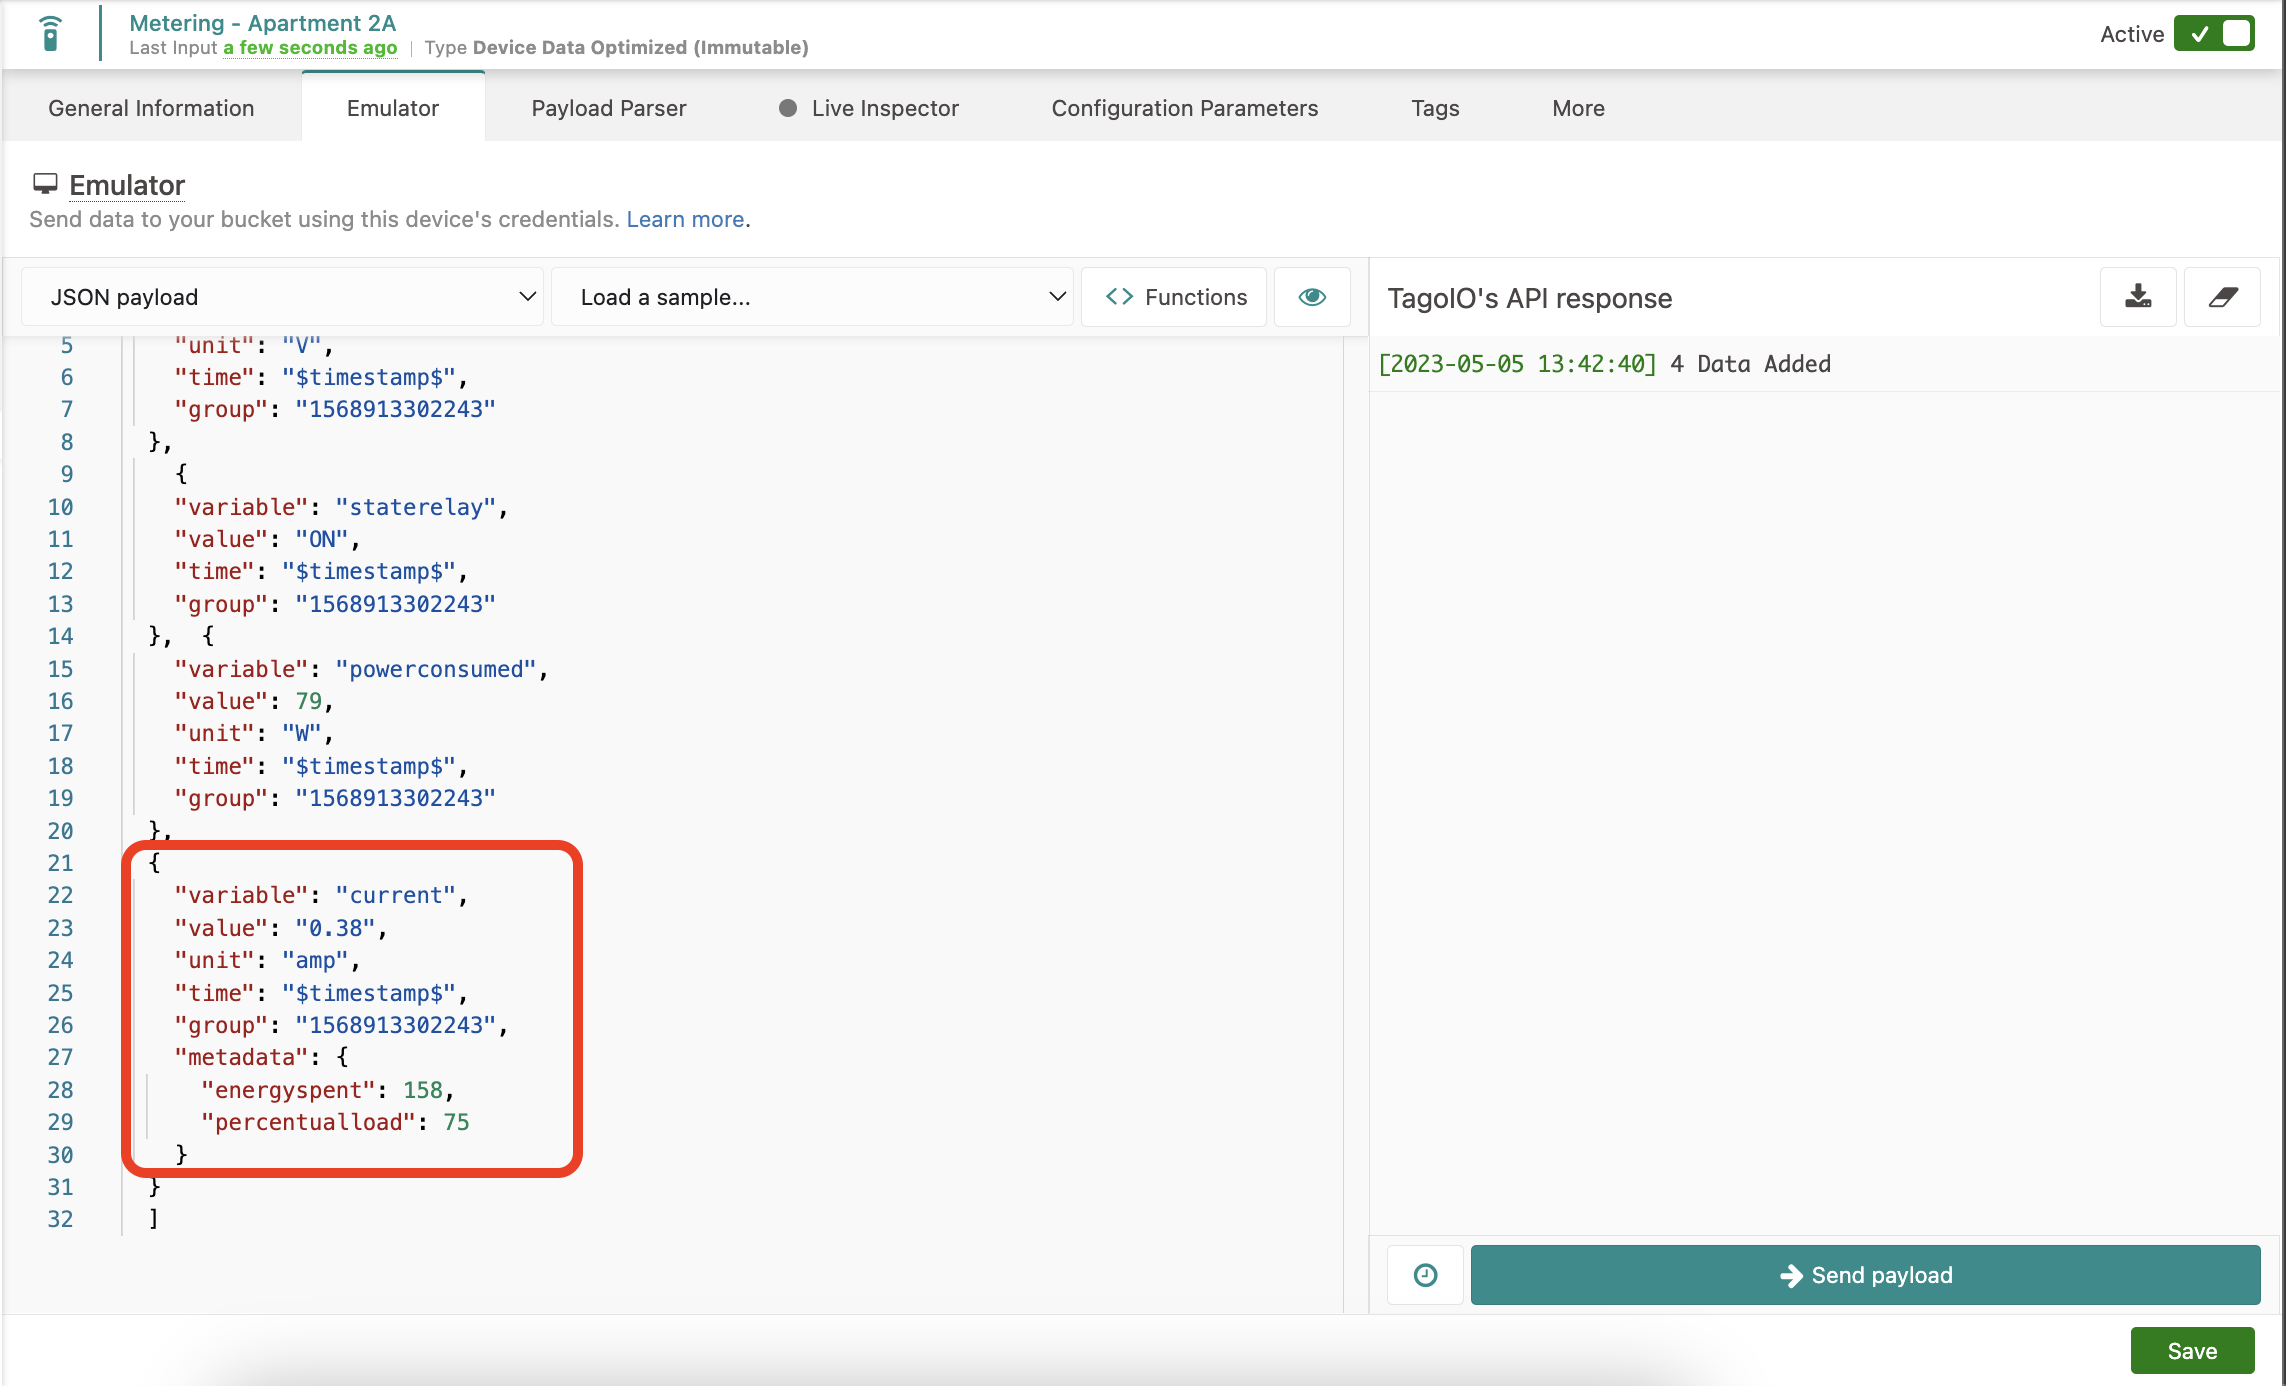
Step 1 - Set the JSON to come like the example below:
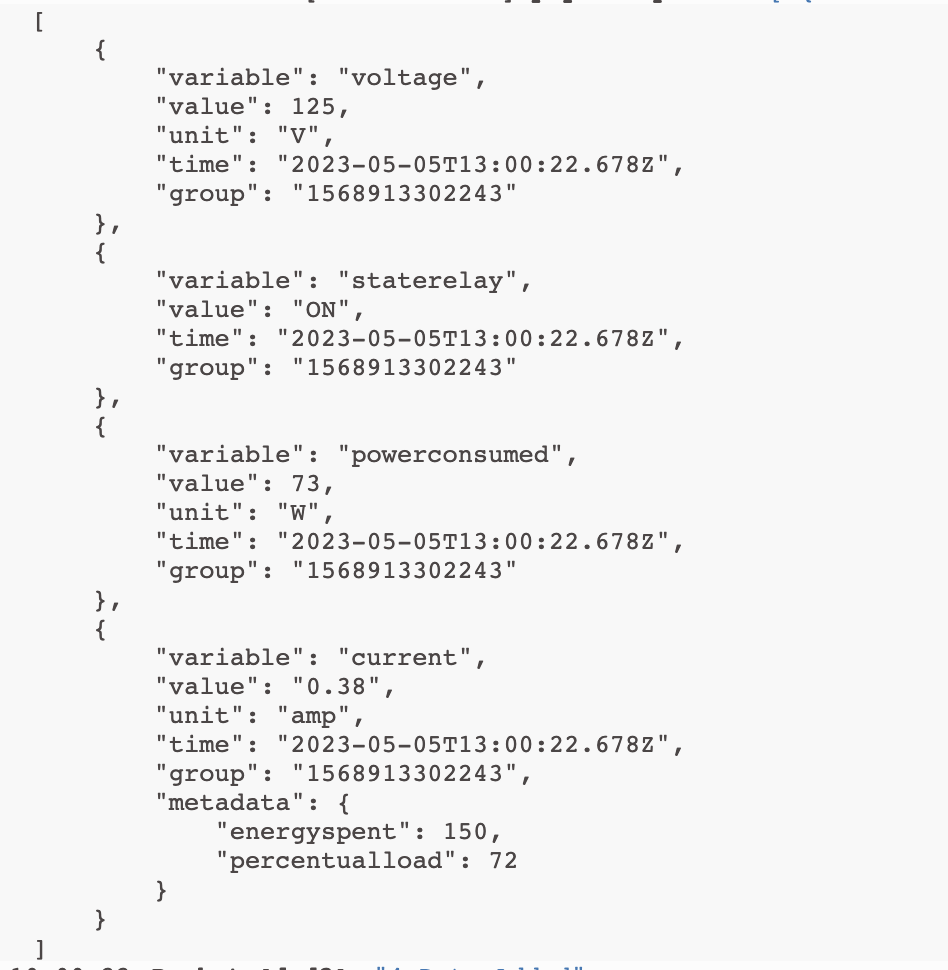
Step 2 - Through the live inspector you should receive a response as below:
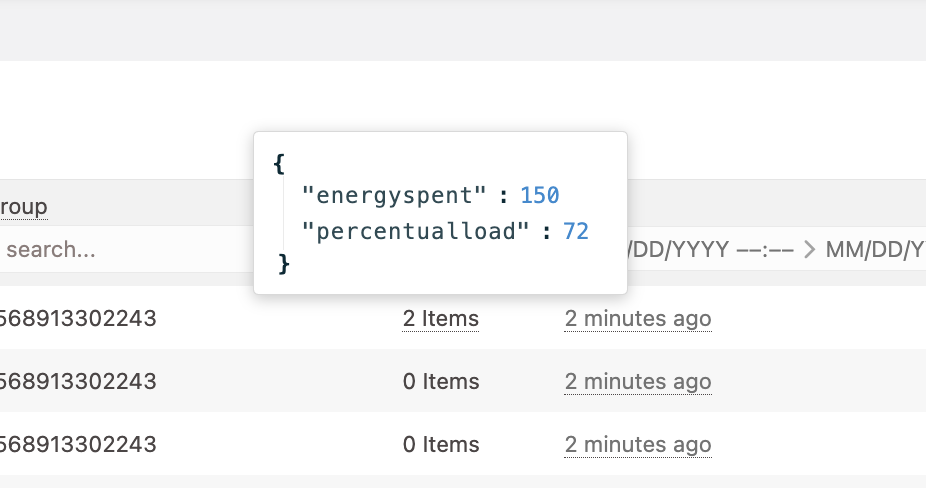
Step 3 - To make sure, go to your buckets and check the "metadata" column to see if you are receiving the correct format
Step 4 - Go to your widget, select the primary variable and then go to the formula settings. Replace the $METADATA.color$ formula with for example, $METADATA.percentualload$ and the fix Unit if applicable as seeing below:
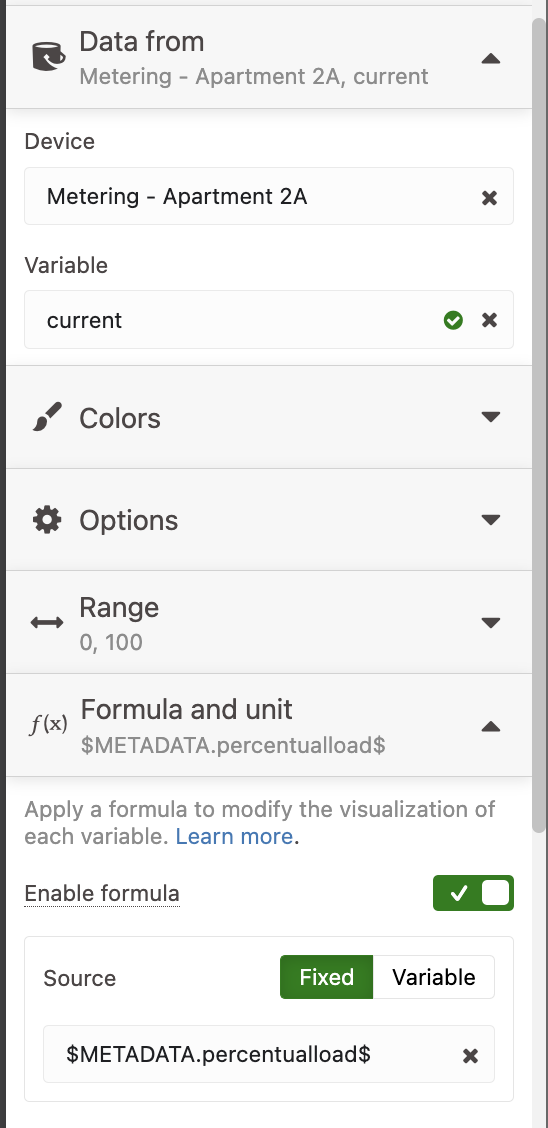
Step 5 - Don't forget to change the alias as it will grab the name of the primary variable, we need to change it to the name of the actual variable.
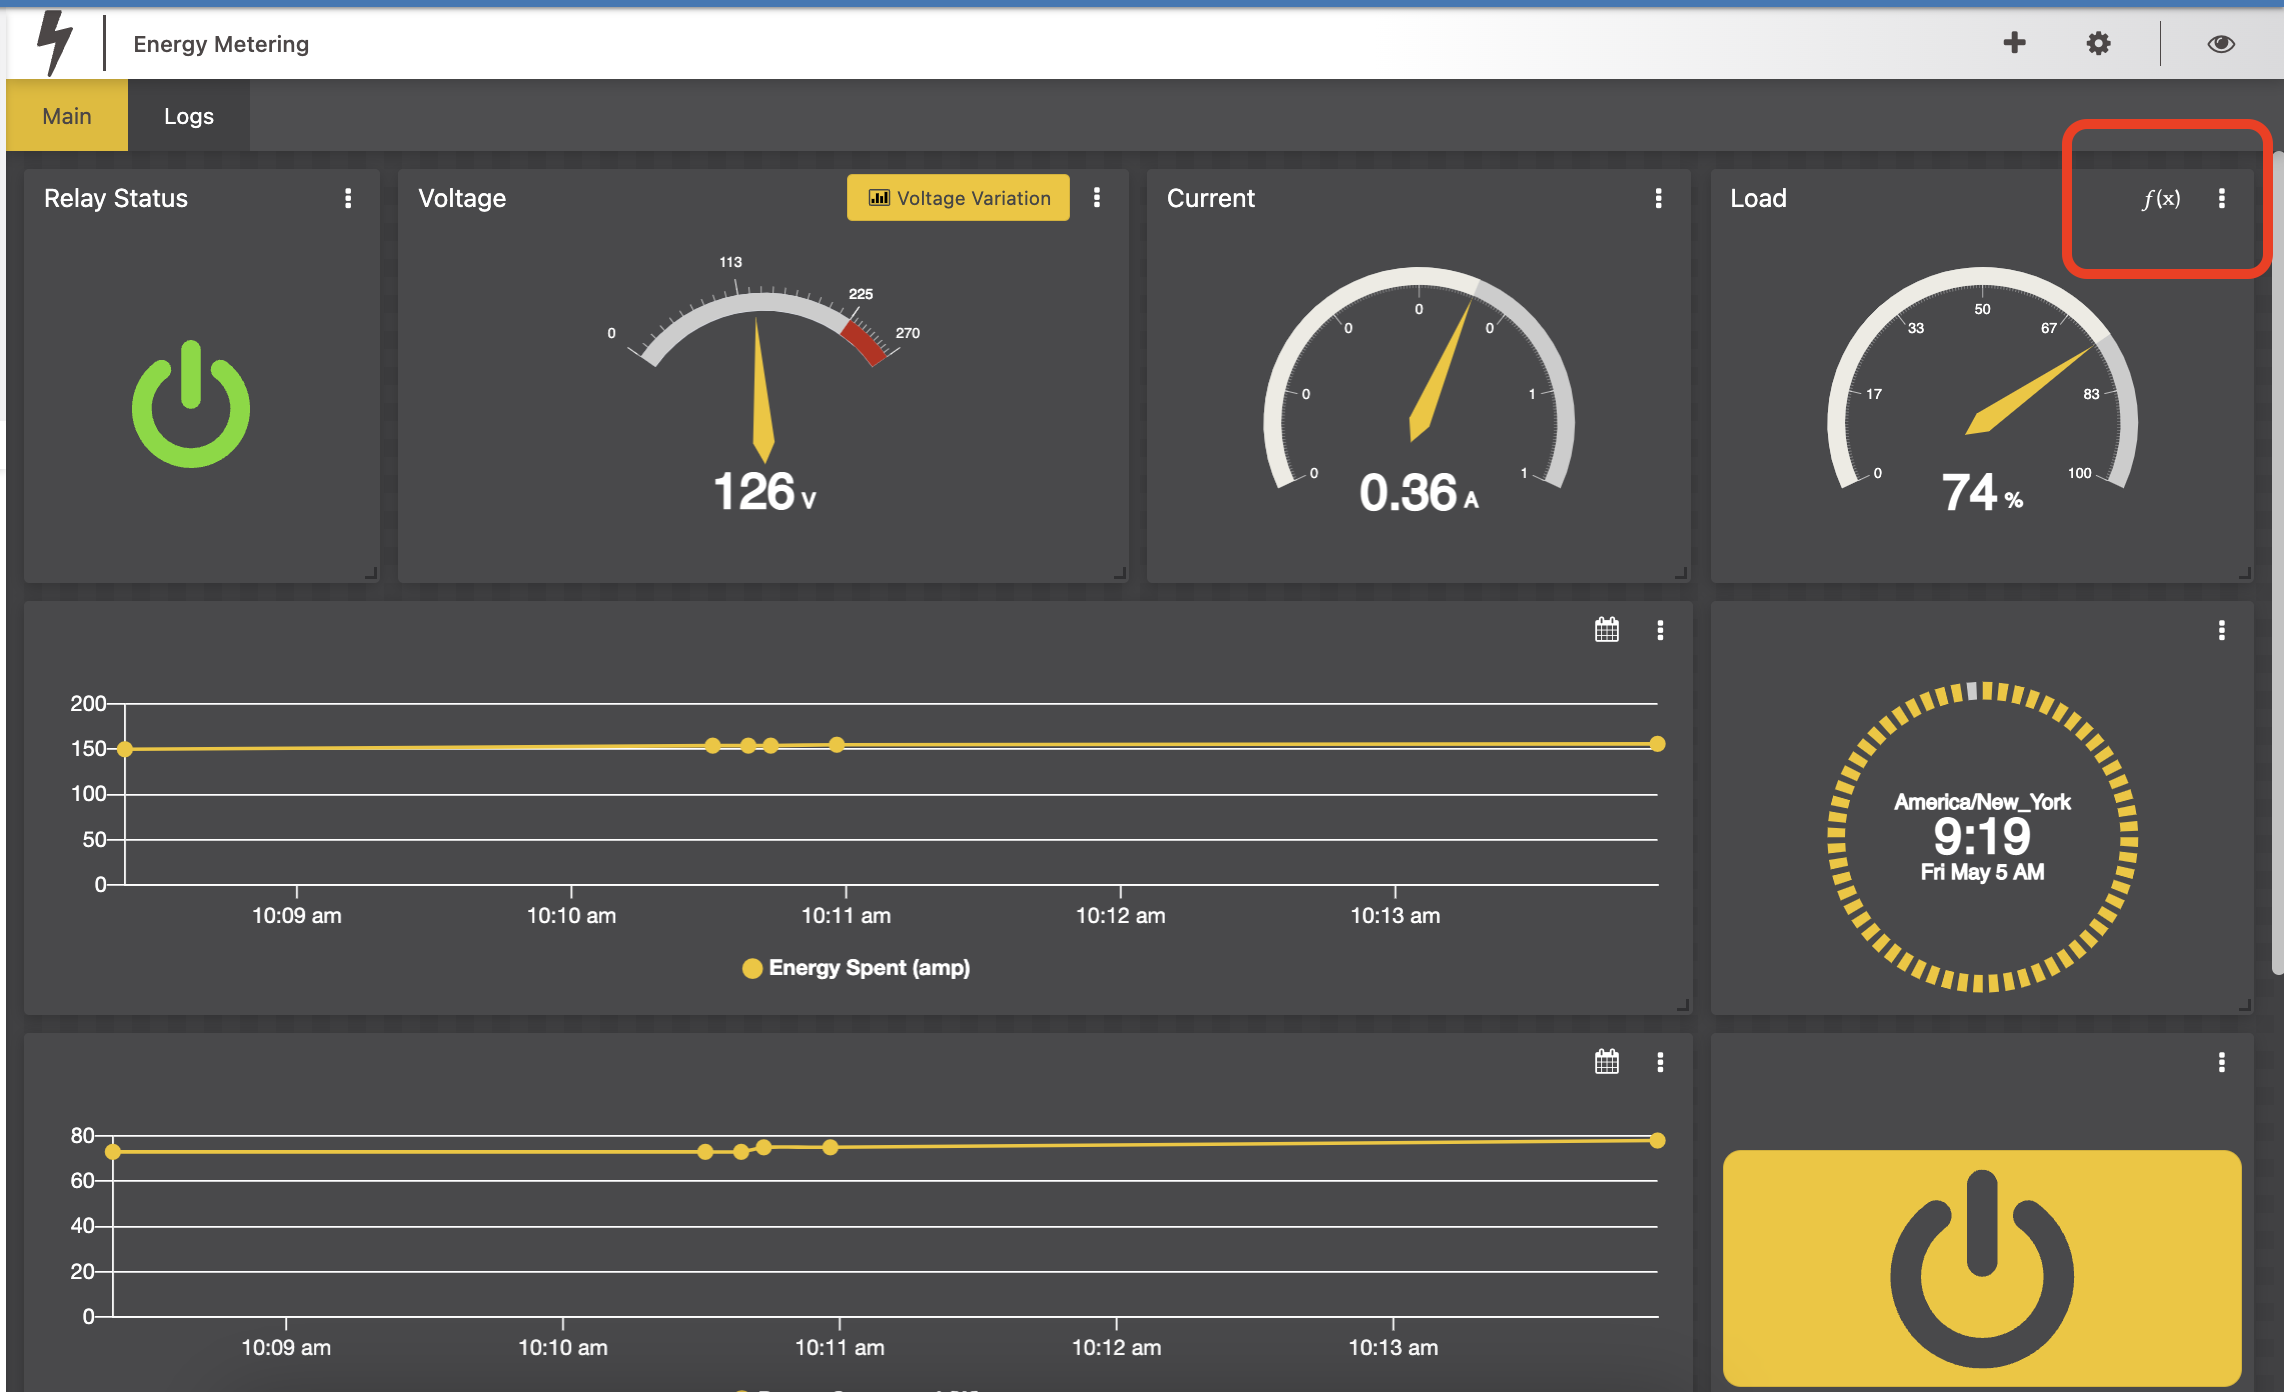
Result:
Topic Participants
Freddy Minuzzi
Gabriel Pupo
Julihermes Melo