How to generate a beautiful PDF using TagoIO
In this article, we will learn how to create beautiful custom PDFs reports using fictional data of a farm at TagoIO.
The HTML code for the PDF can be found clicking here. If you want to modify the end result, you can download this code and edit it as you want. Then you just have to upload it any host that you want and change the URL in the Analysis code.
![]()
The analysis code (Node.js) can be found clicking here.
You can check the Github repository clicking here.
To have a better understanding you should read this article alongside the code.
Disclaimer: You should modify the code according to your needs.
Don’t worry if don’t know much about Javascript or even programming, at the end of this article I will give you some links to the documentation of each Javascript’s functionality that we are going to use.

Adding environment variables
On your report’s page, you should click on the “Environment variables” tab.
In this tab, you need to change the “email” field to a valid email, and the “device_token” to the device token corresponding to the device that you want to use the data.
Click here to learn more about the device token.
Configuring the report
The dashboard_url value should be the URL of the dashboard that you want to redirect your user to.
The variable called background_img_url value should be the URL of the image that you want to use as a background for the report’s header.
You also can change the main color of the report to change the hexadecimal code in the main_color variable.
After this, we will start to prepare our data to be used in our report.
Setting up the data
The first step is to choose the data that you want in your report.
In this example, we will choose four variables to build the report: temperature, soil_moisture, uv_level, and daily_production.
Now, you need to insert your chosen variables inside the “variables” constant in the code sample.
Tip:
Maybe you don’t know yet, but when you get your data from TagoIO, it will come in a structure like this:
[
  {
    "variable": "temperature",
    "value": "28",
    ...
  }
]
TagoIO will always return an array of objects, even if you just have on record, keep this in mind.
That’s why we need to transform our data into a simpler structure to insert it into our PDF report.
In our case, we will need an array with all values to get the maximum temperature in the period.
First, we need to filter the data to get only the information about the temperature.
You will do it like this:
Breaking this code we have:
A variable declaration in which values are a filter of our data. In this filtering, we go through each item and return only the items where the variable property is equal to “temperature”.
After this, we need to do a map to return an array with only the data that we need. For us, it will be the “value” property.
You will do it like this:
Breaking this code we have:
A variable declaration in which values are a mapping of another variable. In this mapping, we go through each item to return only the “value” property from it.
The last step is super easy.
We will use a Javascript function to get the maximum number of an array of numbers.
To do that we will use its Math native class.
The code will look like this:
If you look with attention, you will notice that are three dots before the “temperatures” variables.
This is called spread operation, it spread all the values from our array inside the function.
We need this because the Math.max method doesn’t accept an array, only a set of numbers.
Now you understand how to get the maximum value of an array of numbers.
To get the minimum value, you just need to change the “max” for “min”.
Setting up the chart data
To use our data we will need to arrays of data.
One with the values and another with the legend.
To get the values array, we can repeat the filter and the map step that we did before, only changing it to “daily_production”.
We will have something like this:
It is simple, isn’t it?
To get the second array with our legend we will have a more complicated code, it is a loop to get all dates between two dates.
That’s all for our chart data.
Configuring the PDF
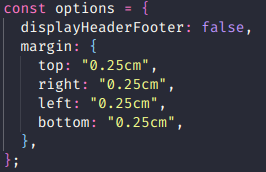
To change the PDF settings you can edit the “options” variable.
Configuring the email delivery
To change the settings of the email that will be sent, you can change the “email_settings” variable.
Reference links
Javascript Math
Javascript array.map
Javascript array.filter
CSS Reference
HTML Reference
Topic Participants
TagoIO .
octaviosanchezz
222925g
Olivia Esso
Freddy Minuzzi


