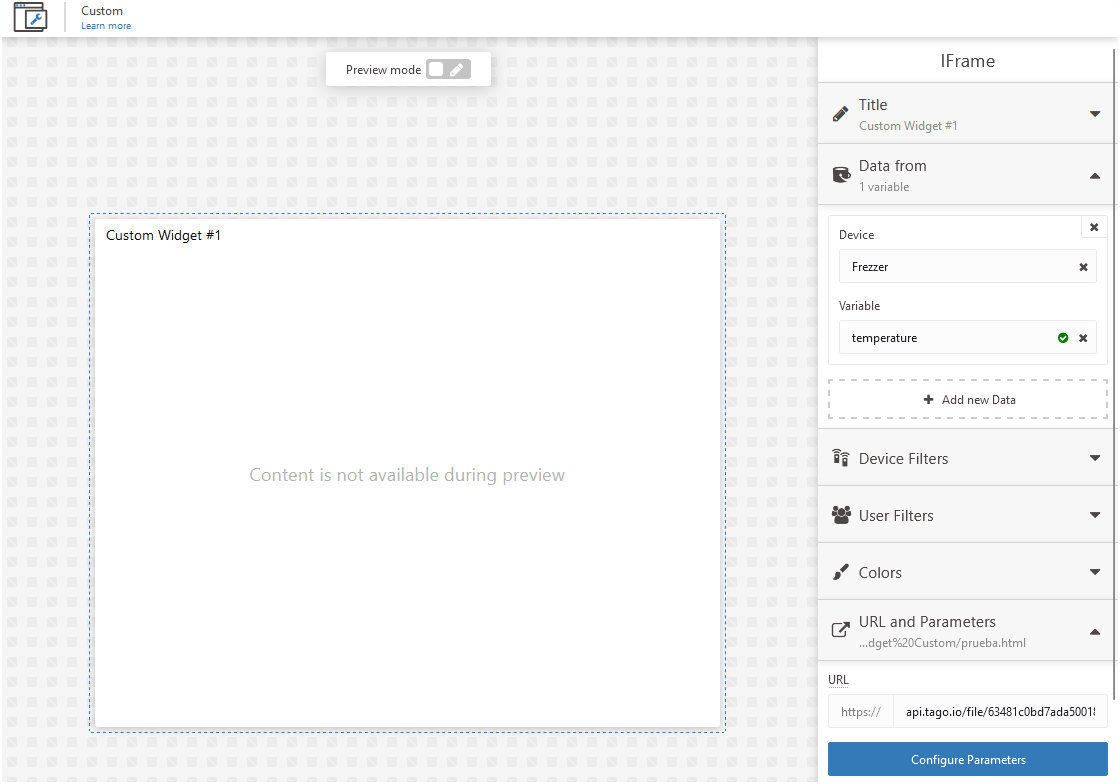
Filter Custom Widget Data
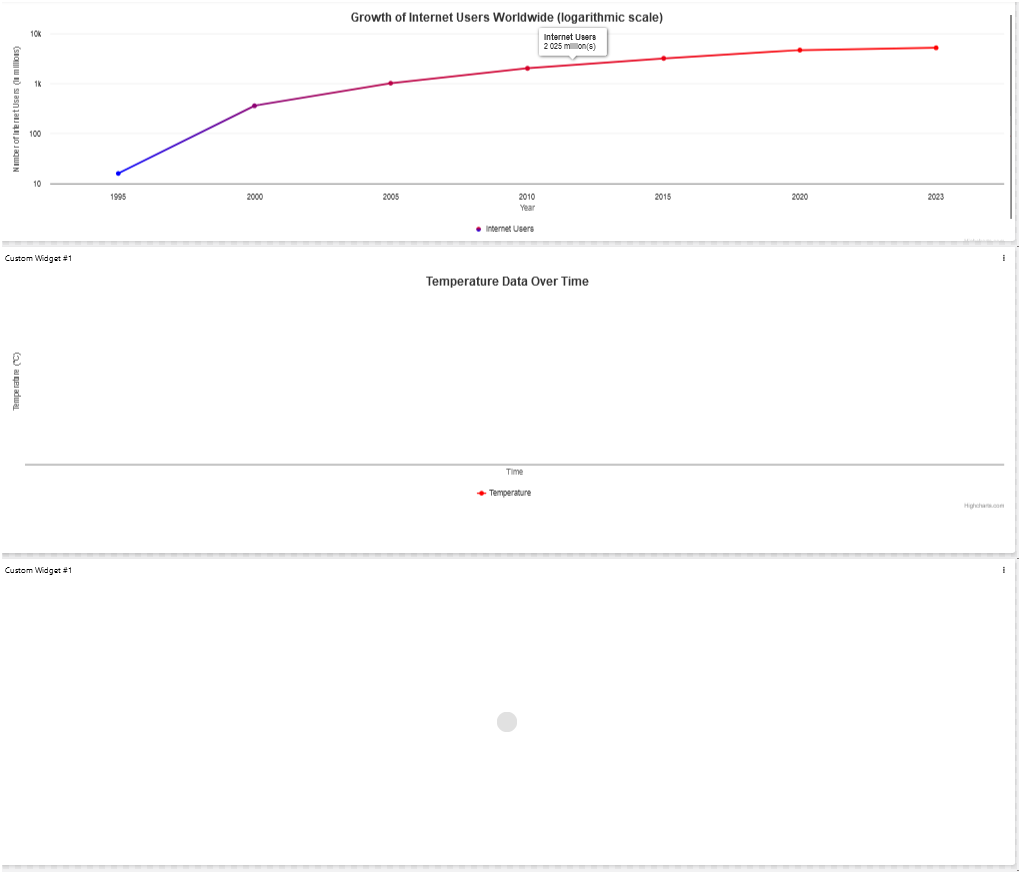
I was able to make some progress but I got stuck when I wanted to
reflect the temperature data of the device in the widget historically. I
will show you 3 widgets, the first one is with the simulated data and
how Highcharts shows it, the second one is modified and designed to see
how the temperature would look historically, and finally there is the
widget that includes the code that I show below, which should filter the
"temperature" data and display it.
Below I leave you the code that I made in the last widget, which should show the temperature historically:
Below I leave you the code that I made in the last widget, which should show the temperature historically:
<!DOCTYPE html>
<html lang="en">
<head>
<meta charset="UTF-8" />
<meta name="viewport" content="width=device-width, initial-scale=1.0" />
<title>Highcharts with Real Temperature Data</title>
<script
type="text/javascript"
></script>
</head>
<body>
<div id="container" style="width:100%; height:400px;"></div>
<script>
// Función para renderizar el gráfico
function renderChart(categories, data) {
Highcharts.chart('container', {
title: {
text: 'Temperature Data Over Time',
},
xAxis: {
title: {
text: 'Time',
},
categories: categories, // Fechas de los datos
},
yAxis: {
title: {
text: 'Temperature (°C)',
},
},
series: [
{
name: 'Temperature',
data: data, // Datos de temperatura
color: '#ff0000',
},
],
});
}
// Inicialización del widget en TagoIO
window.TagoIO.onStart(async (widget) => {
// Obtener los datos de temperatura del dispositivo
const temperatureData = widget.data.filter(
(item) => item.variable === 'temperature'
);
// Procesar los datos para el gráfico
const categories = temperatureData.map((item) => item.time); // Fechas
const data = temperatureData.map((item) => item.value); // Valores de temperatura
// Renderizar el gráfico con los datos obtenidos
renderChart(categories, data);
});
window.TagoIO.ready(); // Indicar que el widget está listo
</script>
</body>
</html>
Topic Participants
octaviosanchezz
Filipe Oliveira