Downsampling in graphs
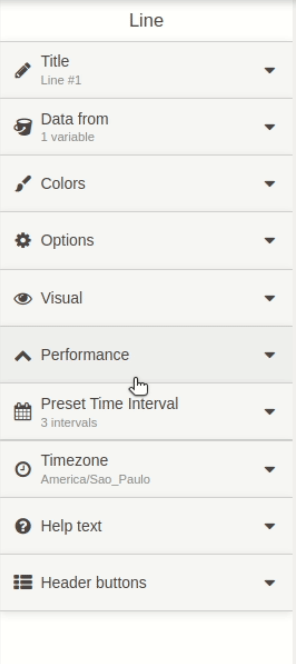
It seems that from a while there's no downsampling option in graph widgets, perhaps the option was moved somewhere else or what?
Currently I have no way of seeing lots of data points without exporting the data to excel.
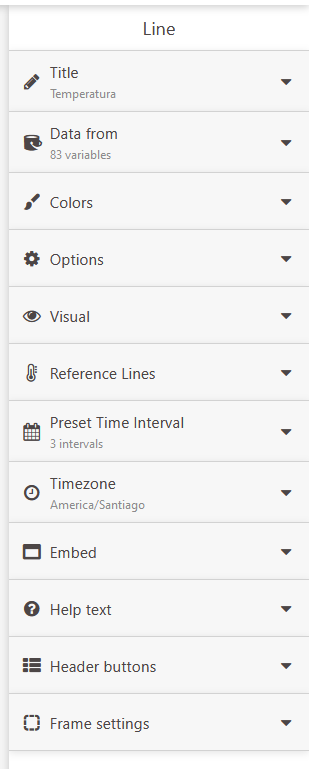
There it was a downsampling for perfomance options in the past: https://help.tago.io/portal/en/kb/articles/507-line-chart-widget#4_Increasing_performance
Topic Participants
ischacht