Creating a historical open/close chart for door sensor
Hi everyone,
I'm trying to create a chart with the somewhat similar features as the following:
I'm trying to create a chart with the somewhat similar features as the following:
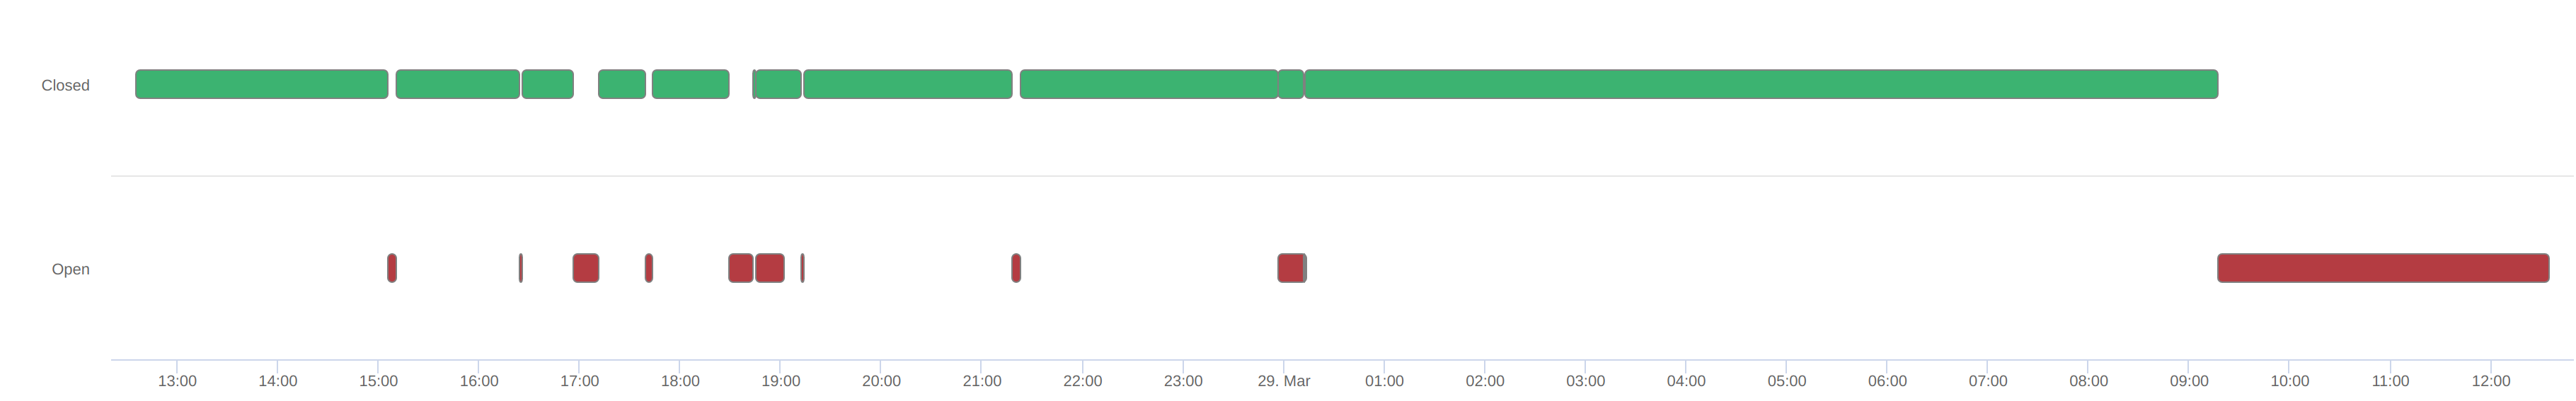
I'm using an LDS03A that sends door_open_status which is either CLOSE or OPEN.
What I was thinking is to use analysis to turn the CLOSE into a 0 and OPEN into a 1 and put those in a new variable door_open_status_bin and run this analysis whenever the sensor sends its data (i.e. when an open is detected).
Then create a normal chart with a date range on the X and a 0 to 1 on the Y to then draw a relatively similar figure to the one shown above.
The problem is: I don't know how to create an analysis script for that. Is there anyone who could lend me a hand and point me in the right direction on how to achieve this? Thanks!
Topic Participants
Ducktator
Guilherme Costa
Freddy Minuzzi
Fabio Rosa