bar graph bar thickness
Hi, I have two charts:
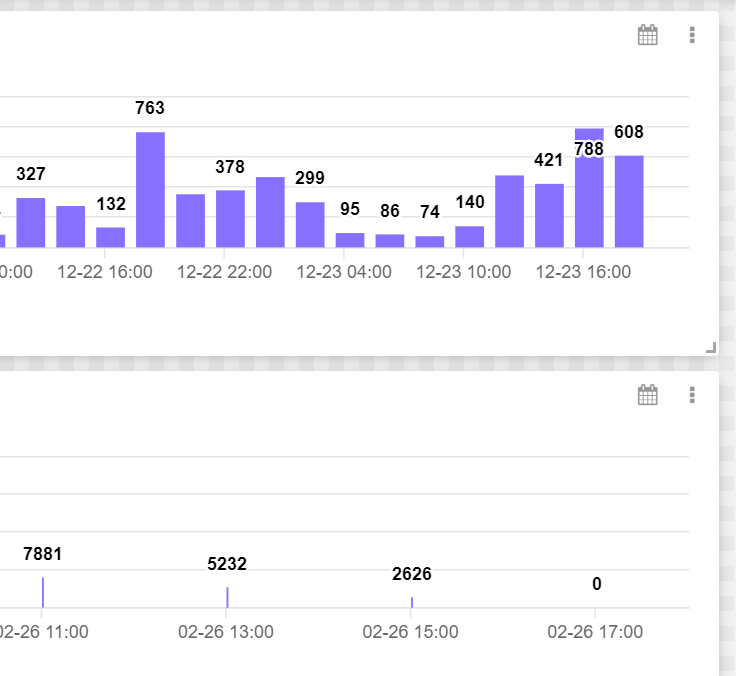
First come from simulation, second from real data. What is the difference? First have ideal interval, second no (avg 3 seconds difference between sample, sample interval 2h)
Why first graph looks good, but second looks worse? Exist any idea how to fix it?
Topic Participants
spulawski
Freddy Minuzzi